When you look into Capgemini’s World Wealth Report, you might see that capital allocations remain stable, with equities and cash largest on the global picture. However, there are some interesting regional differences.
Europe’s HNWI population and wealth both declined by 0.5% and 3.1% respectively in 2018. European HNWIs invested most heavily in equities constituting 28.5% of portfolios. Cash and cash equivalents were not far behind, with 28.3% of the portfolio. The balance of their portfolios was allocated to fixed income (16.8%), real estate (14.5%) and alternative investments (12.0%). While in the Middle East, the size of the HNWI population increased by 5.8% in 2018. Their wealth witnessed an increase of 4.3% as compared to 2.1% and 2.9% in 2017 respectively.
In Africa, the size of the HNWI population decreased by 0.7% in 2018, while wealth decreased by 7.1% to US$ 1.6 trillion.
The situation in North America is stable. North America’s HNWI population grew at a modest pace of 0.4% while HNWI wealth declined by 1.1% in 2018. In this region, cash and cash equivalents replaced equities to form a significant portion of the HNWI’s investment constituting 27.1% of their portfolio. The remaining portfolio was allocated to equities (26.3%), fixed income (18.1%), real estate (15.6%) and alternative investments (12.9%).
A look at Russia gives the impression of growth of HNWis number, despite sanctions and growing tensions with the US. Russian business elite, with its HNWi population of 200.3 thousand, focuses on work in the commodities and financial sector. Half of the Russian HNWi population resides in Moscow region. The balance of their portfolios is more exposed to cash and cash equivalents (25.4%) than to real estate (20.2%), equity (18.8%), alternative investments (17.3%) or a fixed income (18.3%). The average Russian millionaire hold assets worth of USD 5.5M.
The UK population of HNWis dwarves the Russian with its more than twofold size, although the average UK millionaire looks thinner than Russian, being worthy around USD 3.6M. Perhaps this is because asset allocation of the British millionaire is more healthy, bringing in balancing the exposure mostly to equity (27.5%), cash and cash equivalents (27.1%), fixed income (17.7%) and alternative investments (11.8%).
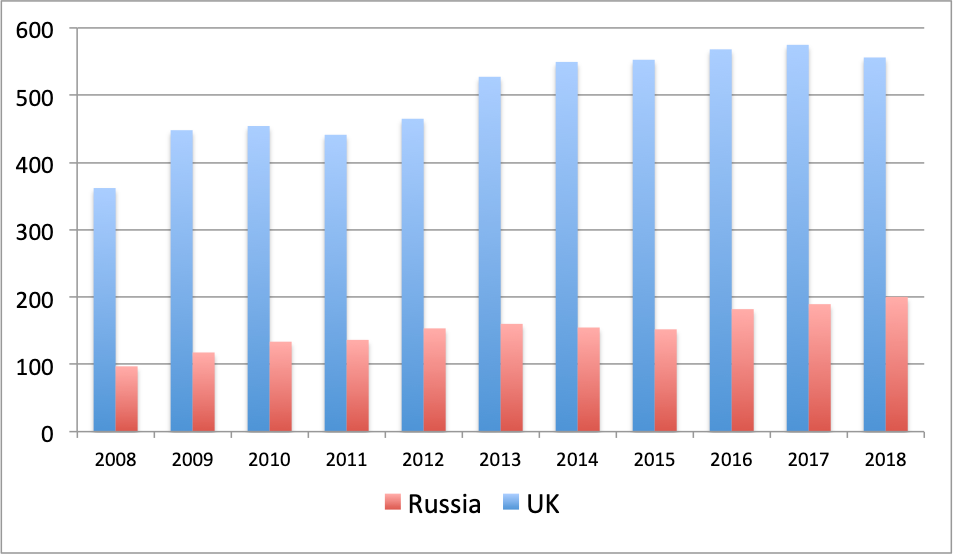
Fig.1 UK vs Russia HNWi population, thousands
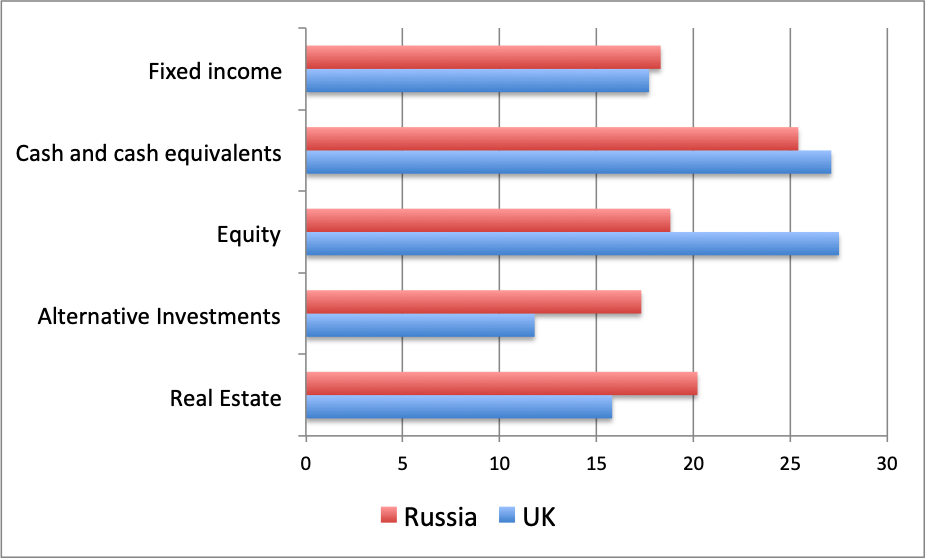
Fig.2 UK vs Russia HNWi portfolio allocation, percents